Sunday, March 31, 2013

Transistor Switching

The transistor is a widely used component in many modern electronic devices. It consists of three leads, the collector, base, and emitter. Current flows from the collector and flows out of the emitter when active. However, current must also flow into the base in order for the transistor to be operational. Our experiment shows how transistors work.

We began by constructing the following circuit:

When the switch is closed, the base is provided with current and thus, current flows through the 2N3904 transistor and lights up the LED shown in the picture above.

The next demonstration is of the same circuit except it shows that the tip of our finger can be used to close the switch and power the transistor 


The next part of the lab was to investigate the amount of current going into the base and coming out of the emitter. The circuit is built as follows:


We found the relationship of the current at A2 and at A1 by turning the linear potentiometer (P1). The results were:


The beta (gain) of the transistor is the ratio of the current coming out of the emitter and the current going into the base. The slope of this graph corresponds to the gain, whose value is 87.362.

Saturday, March 30, 2013

FreeMat

This is a demonstration of the software FreeMat. Its uses are similar to that of the more widely known MatLab. Our sample includes:

1. A graph of the functions sin x and cos x between 0 and 2π.


2. Finding the current through the 10 Ω resistor in the following circuit:

We set iand ito the left and right loop, respectively, with both loops moving clockwise. By setting the systems of equations in FreeMat, shown below,


we find that the current is 0.1857 A in the direction of i.

3. Comparing exponential graphs with different time constants. The first graph is the function e-t/τ


Assignment 1-1 is a graph of 2e-t/τ. One time constant is 100 ms and 200 ms for the other.


Assingment 1-2 is a graph of 2(1-e-t/τ) with the same time constants.


4. Adding sinusoidal functions. 

Assignment 2-1 is the sum of two sinusoids: 3 sin(2t+0.175) and 5 cos(2t-0.525).


Assignment 2-2 is the same graph with a frequency of 10 Hz. The script for the output goes as follows:


and the graph 

Sunday, March 17, 2013

Voltage Dividers

The design of our voltage dividers consists of three load resistors of equal resistances connected parallel and powered by an unregulated power supply. Each load can be switched on or off such that we exhibit an upper and lower bound voltage and resistance. It should be intuitive that closing a switch will give us the maximum equivalent resistance and closing all three switches will give us the minimum resistance. We needed to find the resistance for the shunt resistor (RS) to prevent the system from short circuiting. Our calculated value for Rwas 45.05 Ω and thus our voltage source needed to run at 6.53 V. From these values, we further determined our current (IBUSwith the maximum equivalent resistance was 6.25 mA and 17.2 mA for the minimum equivalent resistance.


Our setup consisted of a resistor box as the shunt resistor and the three parallel load resistors at 1000 Ω each, wired to the breadboard, all connected in series. An ammeter was connected in series with the system to measure IBUS and a voltmeter is connected parallel to the load resistors to measure VBUS.

Our data goes as follows:

1 Load
Req = 9.79 Ω
VBUS = 5.49 V
IBUS = 5.65 mA
PLoad = 0.0312 W


2 Loads
Req = 489 Ω
VBUS = 4.75 V
IBUS = 9.80 mA
PLoad = 0.0470 W


3 Loads
Req = 326 Ω
VBUS = 4.25 V
IBUS = 13.19 mA
PLoad = 0.0567 W

PLoad can be calculated as
PLoad IBUSReq

The actual percentage in load voltage variation was 9.8% and 15.0% up and down, respectively. The variations in the values of the resistance box and the load resistors differed from their true respective values enough to cause a discrepancy.

By adding a fourth 1 kΩ resistor parallel to the circuit, and assuming the shunt resistance and voltage supply remains the same, the new load voltage was calculated to be 5.525 V.

If we wanted to reduce the load voltage variation to ±1% for the 3-load case, our source parameters would have to be V= 5.05 V and R= 46.2 Ω.

Monday, March 11, 2013

Introduction to Biasing

We are looking at two different LEDs in parallel connected to the same battery source. Each LED has a different rating. In order to put the correct voltage through each LED, we use a technique called biasing to establish these predetermined voltages by wiring resistors in series with each LED.

Our setup consists of a 9 V power supply and LEDs rated at 5 V, drawing 22.75 mA and 2 V, drawing 20 mA. We calculated that we need 175 Ω resistor for the 5 V LED and 350 Ω for the 2 V, however, we only had access to 150 Ω and 330 Ω for the experiment.

The setup
We measured voltage and current for three configurations for the LEDs as well as the current in the power supply.

Configuration 1 - Both LEDs in the circuit

ILED1 = 12.86 mA


VLED1 = 6.14 V
ILED2 = 18.85 mA
VLED2 = 2.18 V


ISupply = 31.05 mA

Configuration 2 - Remove LED 2 from the circuit
ILED1 = 13.06 mA
VLED1 = 6.19 V
ISupply = 13.05 mA

Configuration 3 - Remove LED 1 from the circuit
ILED2 = 18.99 mA
VLED2 = 2.21 V
ISupply = 18.96 mA

With a 9 V battery operating at 0.2 A-hr, we calculated that the circuit could operate for 6.4 hours before the battery voltage gets too low.

Our percent error between the achieved current in the LED and the desired value of the two LEDs was 25.63%. The reason for this error was that we did not use the required resistors in our theoretical calculations.

For the efficiency of the circuit with both LEDs, we found the power supplied by the battery (Pin) and the power dissipated by the two LEDs (Pout) to be 279.45 mW and 120.1 mW, respectively. The efficiency is the ratio between the power dissipated and the power supplied which we found to be 43 %

If we changed the design to a 6 V battery while keeping the LED parameters, the efficiency would increase because we will use smaller biasing resistors while keeping the current the same, thus reducing the power dissipated in the load. Using a 5 V supply would give the best efficiency because it will provide the minimum voltage needed to run the circuit while demanding the smallest biasing resistors.

Sunday, March 3, 2013

Introduction to DC Circuits

This lab is a simple application to Ohm's law, V=IR. We looked at the relationship between voltage, resistance, and current going through a load. Our load has a rating of 0.144 W at 12 V and will function properly as long as we maintain a minimum of 11 V. The battery has a capacity of 0.8 Ahr.

With these assumptions, we need to find the maximum distance the load and battery can be separated using the AWG #30 cable. From this, we need to find the resistance in the cable to ensure we meet the 11 V needed to operate this piece of machinery. In practice, we expect there to be a small drop in voltage and we must account for this, especially with the use of long cables.

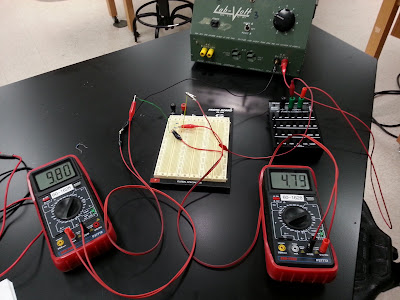
The setup consists of a DC power supply measured at 12.10 V to represent the battery, a variable resistor box as the cable resistance, and a 1000 Ω resistor for the load, all hooked up in series. We included an ammeter in series to measure current and a voltmeter parallel to each of these elements to find the voltage.

The setup with the power supply, resistor, and variable resistor box.
The equivalent circuit.

We began by tweaking the variable resistor to get the load as close to 11 V as possible. We found that with the variable resistor at 89 Ω, our load had a potential drop of 11.0 V according to our voltmeter readings.

Our ammeter measured a current of 12.4 mA. With this measurement, and the fact that the battery has a 0.8 Ahr capacity, we calculated that the time it takes to discharge the battery is 64.5 hours.

By using the formula, P = I2 R, we calculated the power in the load and the cable. Their values were 0.154 W and 0.0137 W, respectively. The measured power of  0.0137 W therefore does not exceed the power capability of the variable resistor box rated at 1 W (written on the side of the resistor box). With these values, the efficiency of the load comes out to be 91.8 %. This means that the remaining 8.2 % is lost to the cables.

Knowing that the maximum cable resistance can go as high as 89 Ω and assuming we are using AWG #30 wires with a resistance of 0.3451 Ω/m, the maximum distance from the battery to the load is 128.9 m in order to maintain the 11 V needed for the device to remain functional.